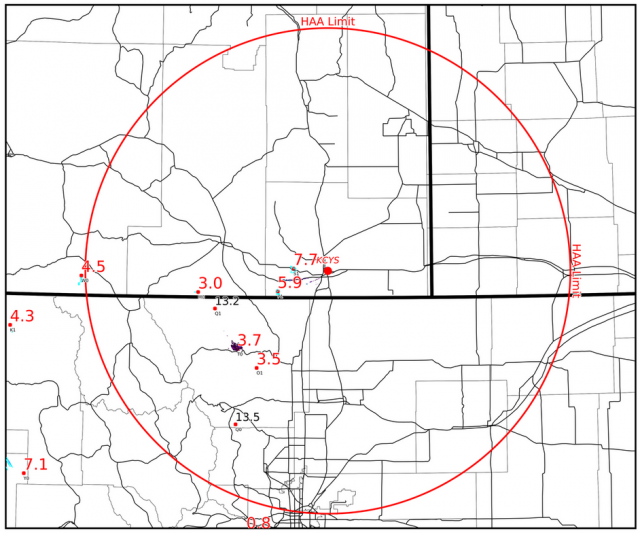
The maps show radar-based hail accumulation (color-coded) and vertically-integrated ice (VII; contours at 10, 50, 100, 150, and 200 g/m^2.). The red dots are the “storms” as determined by the NWS Storm Tracking Information. The numbers are the storm speed, computed by the change of position from the previous time step. Red numbers show up for storms slower than 8 m/s. Red circle indicates the outer boundary of the hail acccumulation algorithm (HAA), which indicates the area where at least one radar beam is located below the melting layer.
The maps show radar-based hail accumulation (color-coded) and vertically-integrated ice (VII; contours at 10, 50, 100, 150, and 200 g/m^2.). The red dots are the “storms” as determined by the NWS Storm Tracking Information. The numbers are the storm speed, computed by the change of position from the previous time step. Red numbers show up for storms slower than 8 m/s. Red circle indicates the outer boundary of the hail acccumulation algorithm (HAA), which indicates the area where at least one radar beam is located below the melting layer. Major roads are in black and county lines are in gray. State borders are in thick black. Click on the image to enlarge.
|
KCYS; Cheyenne, WY
|
KLNX; North Platte, NE
|
|
KFTG; Denver, CO
|
KGLD; Goodland, KS
|
|
KPUX; Pueblo, CO
|
KDDC; Dodge City, KS
|
|
|


